Research & Results

Research & Results

Rigorous research. Real data. Measurable performance.

Showing all 5 validated results — as reported in the AIDurian Terminal Report.

Maturity Classification

NIR · Multispectral

Physiological maturity from eight-band near-infrared reflectance

A ResNet18 model adapted for eight spectral channels classifies durian maturity from non-destructive NIR reflectance measurements across 720–980 nm.

84.37%
Mean accuracy (5-fold CV)
83.47%
Macro F1
  • Dataset: 179 unique Puyat durian fruits, 8 non-contiguous bands (720, 760, 800, 840, 860, 900, 940, 980 nm)
  • Classes: Immature, Mature, Overmature
  • Early stopping when validation macro-F1 plateaued
Illustrative NIR reflectance pattern across the eight bands. Immature fruit were differentiated with near-perfect precision and recall (>99.5%).
LimitationsMature (78.26% F1) and Overmature (72.86% F1) classes showed spectral overlap; bands beyond 980 nm may improve discrimination of advanced maturity stages.
Acoustic Ripeness Classification

Acoustic · CNN

Eating quality from standardized knock-sound analysis

Tapping recordings are converted into spectrograms and classified by a convolutional neural network, giving a non-destructive read on current eating quality.

87.73%
Test accuracy
89.29%
F1 score
  • Dataset: hundreds of standardized tapping recordings processed into spectrogram inputs
  • Additional ~378 acoustic recordings in the structured multimodal collection
  • Classes match the deployed model as validated in the Terminal Report
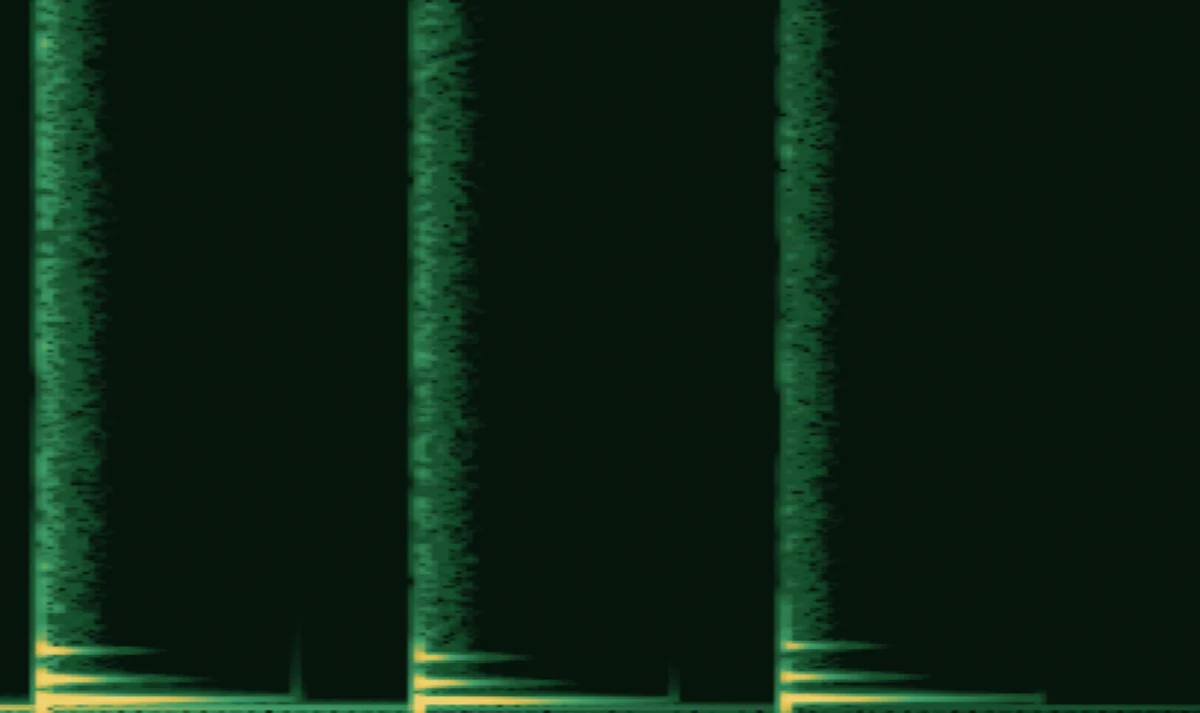
Spectrogram of a durian knock recording
Illustrative spectrogram representation of a knock recording — the input used by the ripeness model.
LimitationsAcoustic quality depends on consistent tapping technique; standardized capture conditions are required for reliable field results.

Defect Detection & Classification

RGB · Detection

Surface defect identification from visible-light images

RGB image analysis identifies and categorizes surface quality issues, supporting external quality screening at grading points.

92.70%
Test accuracy
88.30%
F1 score
  • Best-performing architecture across evaluated candidates
  • Dataset: primary field dataset imagery captured under varying lighting and angles
  • Output: defect category with confidence
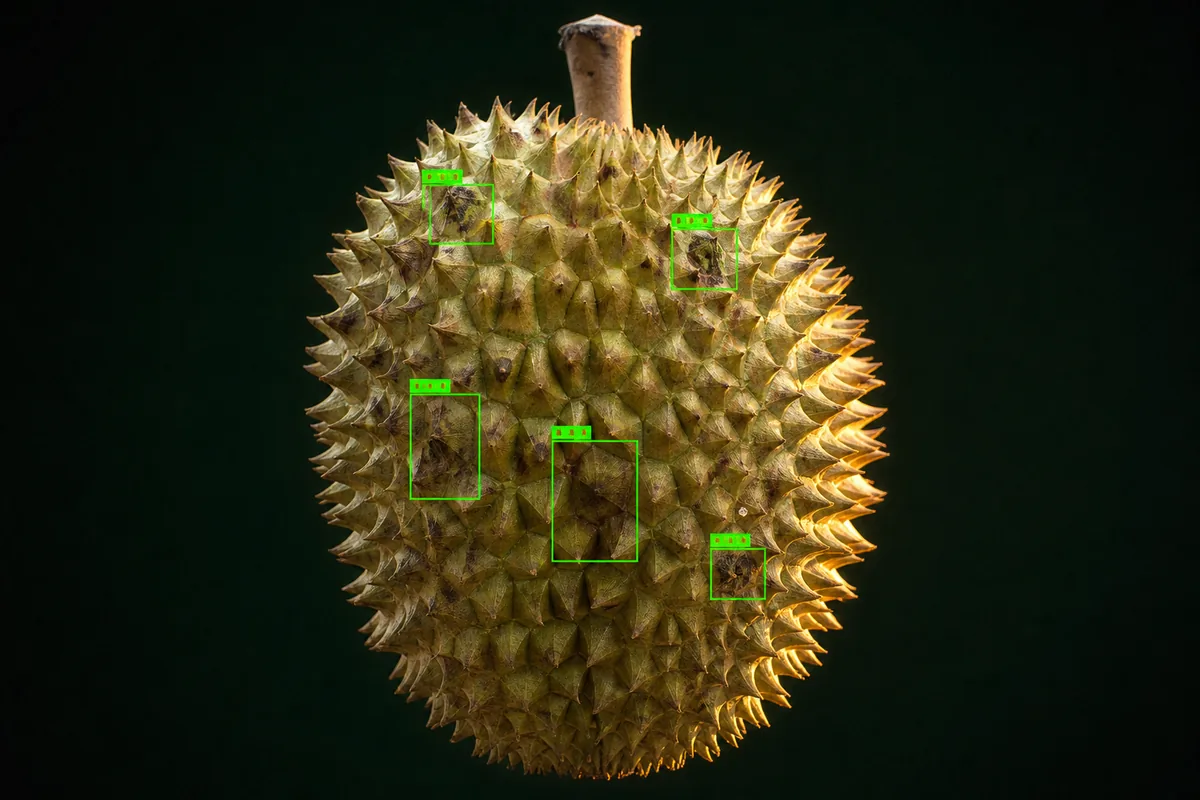
Durian with surface defect detection visualization
Illustrative detection visualization. The model reports surface defects — it does not scan for internal defects.
LimitationsPerformance varies by class distribution and defect difficulty; results reflect the test conditions reported in the Terminal Report.

Shape Classification

RGB · YOLOv11

Regular vs irregular morphology for grading support

YOLOv11, the strongest evaluated model, classifies fruit morphology — supporting grading decisions tied to market requirements and export screening.

91.10%
mAP50
81.85%
F1 score
  • Classes: regular and irregular fruit morphology
  • Base-format model results; int8 mobile conversion traded minor accuracy (87.94% mAP50, 79.02% F1) for ~75% smaller models and faster inference
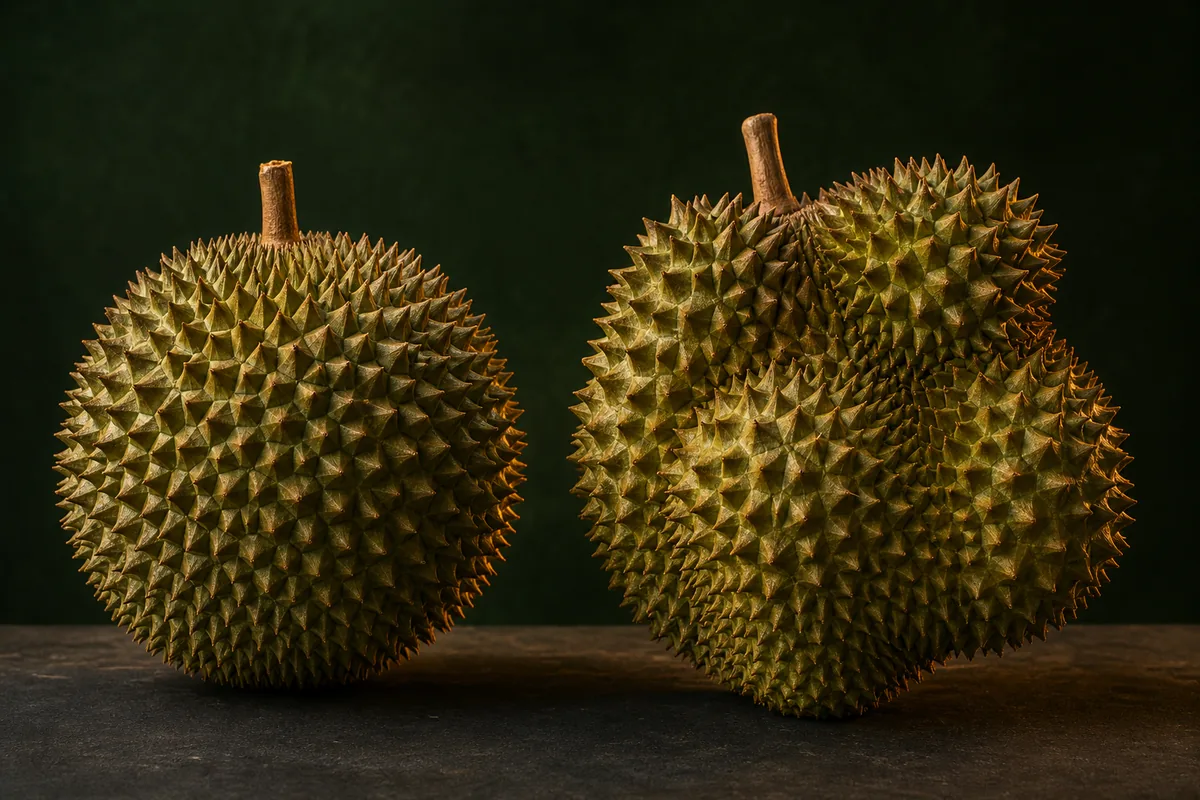
Regular and irregular durian shape comparison
Illustrative comparison of regular and irregular fruit morphology.
LimitationsShape perception can vary with camera angle; standardized capture is recommended.

Locule Segmentation & Counting

RGB · Top view

Locule structure from a top view of the intact fruit

Segmentation models identify and count locules from top-view images of the intact fruit, supporting internal structural assessment with real-time feasible inference.

97.70%
mAP50
98.69%
F1 score
  • Input: top-view RGB image of the intact fruit
  • Non-destructive — no fruit opening required
  • Real-time feasibility demonstrated through fast inference speeds
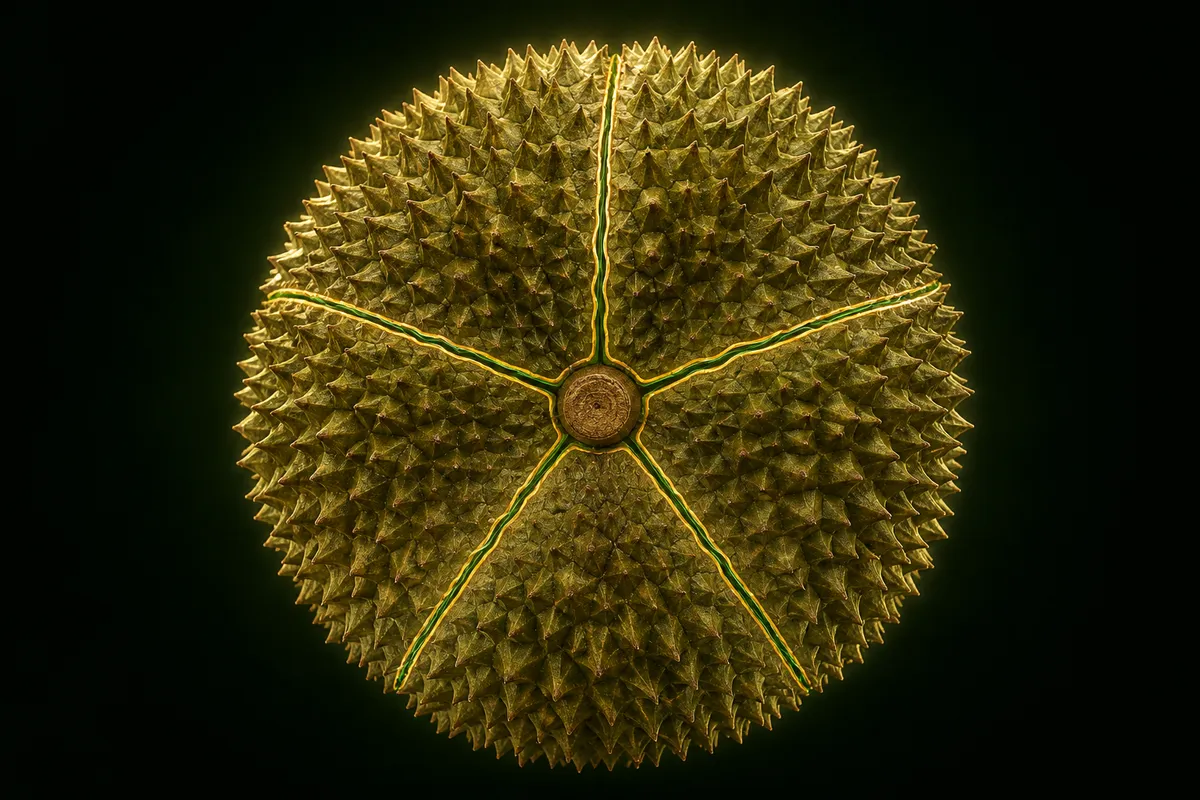
Durian top view with segmented locules
Illustrative segmentation of locules from a top view of a durian.
LimitationsRequires a top-view image of the fruit — the locule pattern is not read from cross-sections or other angles.

How to Read These Numbers

Accuracy

The share of all predictions the model got right. Useful as an overall score, but it can hide weaknesses in specific classes.

F1 score

A balanced measure of precision and recall. It reflects how well the model avoids both false alarms and missed detections.

mAP50

Mean Average Precision at 50% overlap — how precisely detection and segmentation models localize objects, not just label them.

Dive Deeper

Publications, dataset documentation, and the full Terminal Report are available in the project resources.